From Financial Documents to Structured Data: A Traceable AI Workflow for Financial Analysts
Financial analysts in New York, Chicago, and across global markets work with an enormous volume of documents: annual reports, SEC filings, earnings reports, financial statements, research reports, and investment documents. A single 10-K can run several hundred pages. An earnings season can bring dozens of filings across a coverage universe. A due diligence process can involve thousands of pages of supporting materials.
These documents contain critical financial data, but the information is rarely in one place. It is scattered across narrative text, financial tables, footnotes, different sections, and multiple reporting periods. A revenue figure may appear in the income statement, again in the segment disclosure, and again in the MD&A — each with a slightly different scope, definition, or context.
The real challenge is not simply finding a number. It is turning information buried in documents into structured data that can be organized, verified, traced back to its source, and reused in analysis. Gentables Finance Workspace is built for this workflow. Upload financial documents, transform unstructured content into structured tables or objects, and keep every result connected to its source evidence.
Throughout this article, we use the same public 10-K as a running example. We’ll look at three parts: Financial Statements, Segment Information, and Business Overview. This mirrors how analysts actually work — moving between statements, segment disclosures, and business descriptions to build a complete picture.
1. Why Financial Documents Are Difficult to Work With
1.1 Financial Information Is Scattered Across Documents
A single company’s revenue, operating income, debt, and cash flow may appear in different sections: Business Overview, Financial Statements, Management Discussion and Analysis (MD&A), Segment Information, Risk Factors, and Notes to Financial Statements. Each section serves a different purpose and presents data at a different level of granularity.
Consider a typical equity research workflow. To build a simple financial model, an analyst might need:
- Revenue by segment from the Segment Information section
- Operating income and margin from the Consolidated Statements of Operations
- Free cash flow components from the Cash Flow Statement
- Debt maturity schedule from the Notes to Financial Statements
- Management guidance from the MD&A
Finding relevant information often requires more than a keyword search. The same term may appear in dozens of places, each with a different meaning. A search for “revenue” in a 10-K might return hundreds of hits across the document. Without understanding the document’s structure, an analyst can easily pull the wrong figure — or miss the right one entirely.
This is not a new problem. But it has become more acute as the volume of disclosure has grown. Companies today file more detailed segment disclosures, more granular risk factors, and more extensive footnotes than they did a decade ago. The information is there. Finding it efficiently is the challenge.
1.2 Financial Data Appears in Different Formats
The same metric may appear as a structured table, narrative description, footnote, scanned page, or inconsistent layout. You may also see different units, number formats, negative signs, reporting periods, and table structures.
For example:
Revenue: $12,450 million
Revenue: $12.45 billion
Revenue increased to 12.45B
These may represent the same or related data, but structured extraction requires understanding context and units. A figure expressed in millions is not directly comparable to one expressed in billions without conversion. A negative number shown in parentheses means something different from one shown with a minus sign. A table with three years of data is not the same as a narrative sentence referencing a single period.
Financial documents also vary widely in layout. Some companies present financial statements in a clean, multi-year format. Others embed key figures in dense paragraphs. Some use bold headings and clear tables. Others rely on footnotes and cross-references. A structured workflow must be able to handle this variability without forcing the analyst to manually reformat everything.
1.3 Financial Data Requires Context, Not Just Extraction
Financial data is context-dependent. A value like $12.45B means little without knowing:
- Reporting Period: FY2024, Q4 2025, Three months ended December 31
- Measurement Scope: Consolidated, Segment, Geographic
- Units and Currency: million, billion, USD
- Accounting Context: GAAP vs. Non-GAAP, Reported vs. Adjusted, Continuing Operations vs. Total Operations
Financial data requires more than numerical extraction. Its meaning depends on reporting period, scope, units, and accounting context. An analyst who extracts a revenue figure without capturing its period and scope may end up comparing apples to oranges — a mistake that can propagate through an entire model.
Consider a common scenario. A company reports “Revenue increased 8% to $12.45 billion.” Is that consolidated revenue? Segment revenue? Revenue from continuing operations? Does it include or exclude divested businesses? Is it GAAP or adjusted? Without the surrounding context, the number alone is ambiguous.
This is why structured data in finance is not just about extracting numbers. It is about extracting numbers along with the metadata that makes them meaningful: period, scope, unit, currency, and accounting basis.
1.4 Manual Data Collection Still Consumes Analyst Time
Traditional workflows often look like this:
Open Financial Report
        ↓
Search for Relevant Information
        ↓
Copy Data into Excel
        ↓
Reformat and Organize
        ↓
Check Against Original Document
        ↓
Repeat for Other Documents
This process is repeated for every company, every quarter, every document. For an analyst covering 20 companies, the manual effort compounds quickly. A single 10-K might take hours to mine for the necessary data points. Multiply that across a coverage universe, and the time spent on data collection can easily exceed the time spent on actual analysis.
Structured tools can reduce repetitive work, but they do not remove the need for professional review. The goal is to make data collection, verification, and reuse more efficient — so analysts can spend more time interpreting data and less time copying it.
1.5 A Financial Value Needs Evidence
A financial value is not just a number. If you see Revenue = 12.45B, you may also need to know: Which company? Which fiscal year? Which business segment? Which unit? Which table or passage? How was the original data expressed?
The challenge is not simply extracting financial information. It is preserving the context and source information needed to understand and use that data correctly.
In practice, this means that every structured value should be traceable to its source. If a number appears in a table, the analyst should be able to click on it and see the original passage, the surrounding context, and the exact location in the document. This is not just a convenience — it is a requirement for professional-grade financial data work.
2. Understanding Financial Document Structure Before Extraction
Structured data extraction starts with understanding where relevant information lives in the document.
2.1 Where Financial Information Lives in a 10-K or Annual Report
Financial documents have an internal structure. An annual report or 10-K may include:
Annual Report
│
├── Business Overview
├── Risk Factors
├── Financial Performance
│   ├── Revenue
│   ├── Operating Income
│   └── Cash Flow
├── Segment Information
├── Debt and Capital Structure
└── Notes to Financial Statements
This structure is not arbitrary. It reflects how companies organize their disclosures and how regulators expect information to be presented. Understanding this structure is the first step toward efficient extraction.
Different documents will have different structures. A 10-K for a large-cap company may have extensive segment disclosures, while a smaller company may report as a single segment. An annual report for a European company may follow IFRS conventions rather than US GAAP. A quarterly filing may be shorter but still contain critical updates.
Gentables Finance Workspace helps users extract and view the document outline, select a relevant section, and understand that different sections contain different types of data and semantics. This is not about replacing the analyst’s judgment — it is about giving them a map of the document before they start extracting.
2.2 Use Outline and Sections to Define Scope
One of the most practical features of a structured workflow is the ability to define scope before extraction. Instead of processing an entire 400-page 10-K, an analyst can select a specific section — say, “Liquidity and Capital Resources” — and work only with the content that matters for a given task.
This mirrors how analysts actually work. When building a cash flow model, you don’t need the Risk Factors section. When analyzing segment performance, you don’t need the Notes on pensions. By narrowing the scope, you reduce noise and improve the quality of the extracted data.
Gentables supports this by letting users:
- View the document outline
- Select a specific section
- Discover topics within that section
- Filter chunks by topic or section
This is a fundamentally different approach from keyword search. Instead of guessing where information might be, the analyst can navigate the document the way it was designed to be read.
2.3 Discover Topics Within a Section
Once a section is selected, Topic Discovery helps surface the key themes within that section. For example, if you focus on liquidity, debt, and cash flow, you can select the “Liquidity and Capital Resources” section and discover relevant topics such as Cash Flow, Debt Obligations, Liquidity Sources, and Capital Requirements.
Topic Discovery helps narrow the scope for structured data generation; it does not replace the user’s definition of the analysis scope. The analyst remains in control of what matters. The system simply helps surface what is there.
This is particularly useful when working with unfamiliar documents. An analyst covering a new company for the first time may not know exactly where to look. Topic Discovery provides a starting point — a way to quickly understand what a section covers before diving into extraction.
2.4 Filter Chunks While Preserving Context
Users can filter chunks by topic or section and review only the text passages and tables related to those topics. This reduces the burden of manually searching long documents and provides clearer context for structured data generation.
Example: Turn Segment Financial Information into a Structured Table
Using the same 10-K, suppose we select the Segment Information section. The outline shows the section, topic discovery surfaces Revenue, Operating Income, and Geographic Information, and relevant chunks are filtered. The result is a structured segment table:
| Segment | Revenue | Operating Income | Period | |
|---|---|---|---|---|
| Americas | 178,353 | 72,480 | FY2025 | |
| Europe | 111,032 | 47,739 | FY2025 | |
| China | 64,377 | 26,917 | FY2025 |
 Figure 1. From 10-K outline and section selection to topic discovery, chunk filtering, and a structured segment table. Source: Gentables Finance Workspace.
This example illustrates the full workflow: from document structure to structured data. The analyst selects a section, discovers topics, filters chunks, and generates a table. Every step is guided by the document’s own organization, not by guesswork.
2.5 Why Document Structure Matters for Data Quality
The same metric may appear in multiple locations: Consolidated Revenue, Segment Revenue, Geographic Revenue. Without proper document context, extraction may fail to distinguish their scope and meaning.
Consider a company with three reporting segments. The consolidated income statement shows total revenue. The segment disclosure breaks that revenue down by segment. The geographic disclosure breaks it down by region. If an analyst extracts “revenue” without specifying which one, the result may be misleading.
Understanding document structure helps establish the context for extracting the right information — not just finding matching text. It ensures that the data you extract is the data you actually need.
3. Building Structured Financial Data from Documents
3.1 Different Financial Information Needs Different Data Structures
Tables organize repeated records and comparable metrics. Objects organize structured information that may not naturally fit into rows and columns.
Tables are useful for financial metrics, historical data, segment performance, company comparisons, and repeated records. When you have multiple periods, multiple segments, or multiple companies, a table is the natural format. It allows for easy comparison and calculation.
Objects are useful for company profiles, business overviews, financial summaries, investment memo summaries, and management guidance summaries. When the information is descriptive rather than numeric — a business description, a list of segments, a summary of guidance — an object with defined fields is more appropriate than a table.
The distinction matters because not all financial information fits neatly into rows and columns. A company’s business description, for example, is not a table. It is a structured object with fields like business_description, business_segments, and key_characteristics. Gentables supports both formats, so users can choose the structure that fits the data.
3.2 Extract Existing Tables and Forms
Gentables can automatically extract existing tables and form data from documents. This is especially useful when financial statements, schedules, or disclosures already contain structured layouts.
Many financial documents include tables that are already well-structured. The income statement, balance sheet, and cash flow statement are obvious examples. But there are also tables in the segment disclosure, the debt footnote, the lease note, and the pension disclosure. Extracting these tables automatically saves time and reduces transcription errors.
Form data — such as the cover page of a 10-K or the summary compensation table in a proxy statement — can also be extracted. This is useful for building structured records from standardized filings.
3.3 Generate Structured Records with Extract
Using the same 10-K, a user can request:
Extract annual revenue, operating income, and free cash flow for the last three fiscal years.
The result is a structured table with relevant source context:
Apple Inc. Annual Revenue, Operating Income, and Free Cash Flow for Fiscal Years 2023-2025 (in Million USD)
| Fiscal Year | 2025 | 2024 | 2023 |
|---|---|---|---|
| Annual Revenue | 416,161 | 391,035 | 383,285 |
| Operating Income | 133,050 | 123,216 | 114,301 |
| Free Cash Flow | 111,482 | 118,254 | 110,543 |
The Extract capability is designed for repeated records and comparable metrics. It takes a user requirement — expressed in natural language — and generates a structured table from the selected document content. The table includes not just the values, but also the source context, so the analyst can verify where each figure came from.
This is particularly useful for building historical financials. An analyst covering a company for the first time can extract three to five years of key metrics in a single pass, rather than manually pulling each figure from each statement.
3.4 Create Structured Objects with Summarize
Using the same 10-K’s Business Overview section, a user can request:
Create a structured company profile based on the Business Overview section.
The result is a structured object:
json
{
  "company_profile": {
    "business_description": "...",
    "business_segments": [],
    "revenue_sources": [],
    "key_operating_characteristics": []
  }
}
Summarize is not limited to plain text summaries; it can generate objects with clear field structures. This is important because financial professionals often need structured information, not just a paragraph of text. A company profile with defined fields can be used in a database, a CRM, or an internal report. A paragraph of text cannot.
The Summarize capability is also useful for management guidance. Instead of reading through pages of MD&A, an analyst can generate a structured summary of guidance by segment, by metric, and by period.
3.5 Populate Existing Financial Templates
Many financial professionals already have their own Excel templates. These templates may have been built over years and reflect a specific analytical approach. Gentables supports uploading an existing table template and filling it from the current document.
Existing Financial Template
            ↓
Upload Template
            ↓
Match Required Fields
            ↓
Extract Relevant Information
            ↓
Populate Structured Data
This is a significant workflow advantage. Instead of redesigning a table from scratch, the analyst can use the template they already trust. The system matches the required fields to the document content and populates the data. The result can be edited, exported, and reused.
For investment banking professionals who work with standardized templates for comparable company analysis or transaction summaries, this capability can save hours of manual data entry.
3.6 Compare Financial Data Across Documents and Entities
Users can build comparable structured data from multiple documents or related information, including Revenue, Operating Income, Operating Margin, and Free Cash Flow.
Comparable analysis is a core part of equity research and investment banking. Building a comp table manually requires pulling data from multiple companies’ filings, normalizing for different fiscal years, and adjusting for non-recurring items. Gentables can help streamline this process by extracting comparable data from multiple documents into a single structured table.
The Compare capability is not limited to companies. It can also be used to compare periods within the same company, segments within the same filing, or scenarios within the same analysis.
3.7 Analyze Collected Data into Tables, Charts, and Results
Based on collected data, Gentables can generate analytical results, including calculations, analysis tables, charts, and data trends. Data extraction is the foundation of analysis; the credibility of analysis results depends on input data, definitions, calculation methods, and sources.
The Analyze capability is designed to work with the structured data you have already built. It does not replace the analyst’s judgment. It simply provides a way to generate calculations, tables, and charts from the data that has been extracted and verified.
For example, an analyst who has extracted revenue, operating income, and free cash flow for three years can use the Analyze capability to calculate growth rates, margins, and trends. The results can be displayed in a table or chart and exported for use in a presentation or report.
3.8 From User Requirements to Structured Results
Define Information Requirements
             ↓
Select Document Scope
             ↓
Generate Structured Table or Object
             ↓
Review and Refine Results
             ↓
Reuse for Further Analysis
This workflow is flexible enough to support a wide range of tasks. Whether you are building a financial model, preparing a company profile, populating a template, or comparing multiple companies, the same basic steps apply: define what you need, select where to look, generate the structure, review the results, and reuse them.
4. Verification and Source Traceability: Source-Grounded Financial Data
4.1 Why Financial Data Needs Evidence, Not Just Extraction
Financial data often needs to be re-checked, explained, compared against original files, modified, and reused in other analyses. A structured value becomes more useful when users can understand where it came from and review the original context.
In finance, the ability to trace a number back to its source is not optional. It is a professional requirement. Analysts are frequently asked: “Where did this number come from?” “Which filing?” “Which page?” “Was it GAAP or adjusted?” A structured data workflow that cannot answer these questions is of limited value.
This is why Gentables treats verification and traceability as first-class features, not afterthoughts. Every extracted value can be linked to its source evidence. Every table cell can be verified. Every object field can be traced back to the original document.
4.2 Cell-Level Verification for Financial Tables
Using the Revenue row from the 10-K example in Section 3.3, each cell can be verified against its source evidence.
| Metric | Value | Verification |
|---|---|---|
| Revenue | 416,161 | Source evidence |
| Operating Income | 133,050 | Source evidence |
| Free Cash Flow | 111,482 | Source evidence |
Each cell can be linked to the relevant source text or table content, the source chunk, the original document location, and a verification status or result.
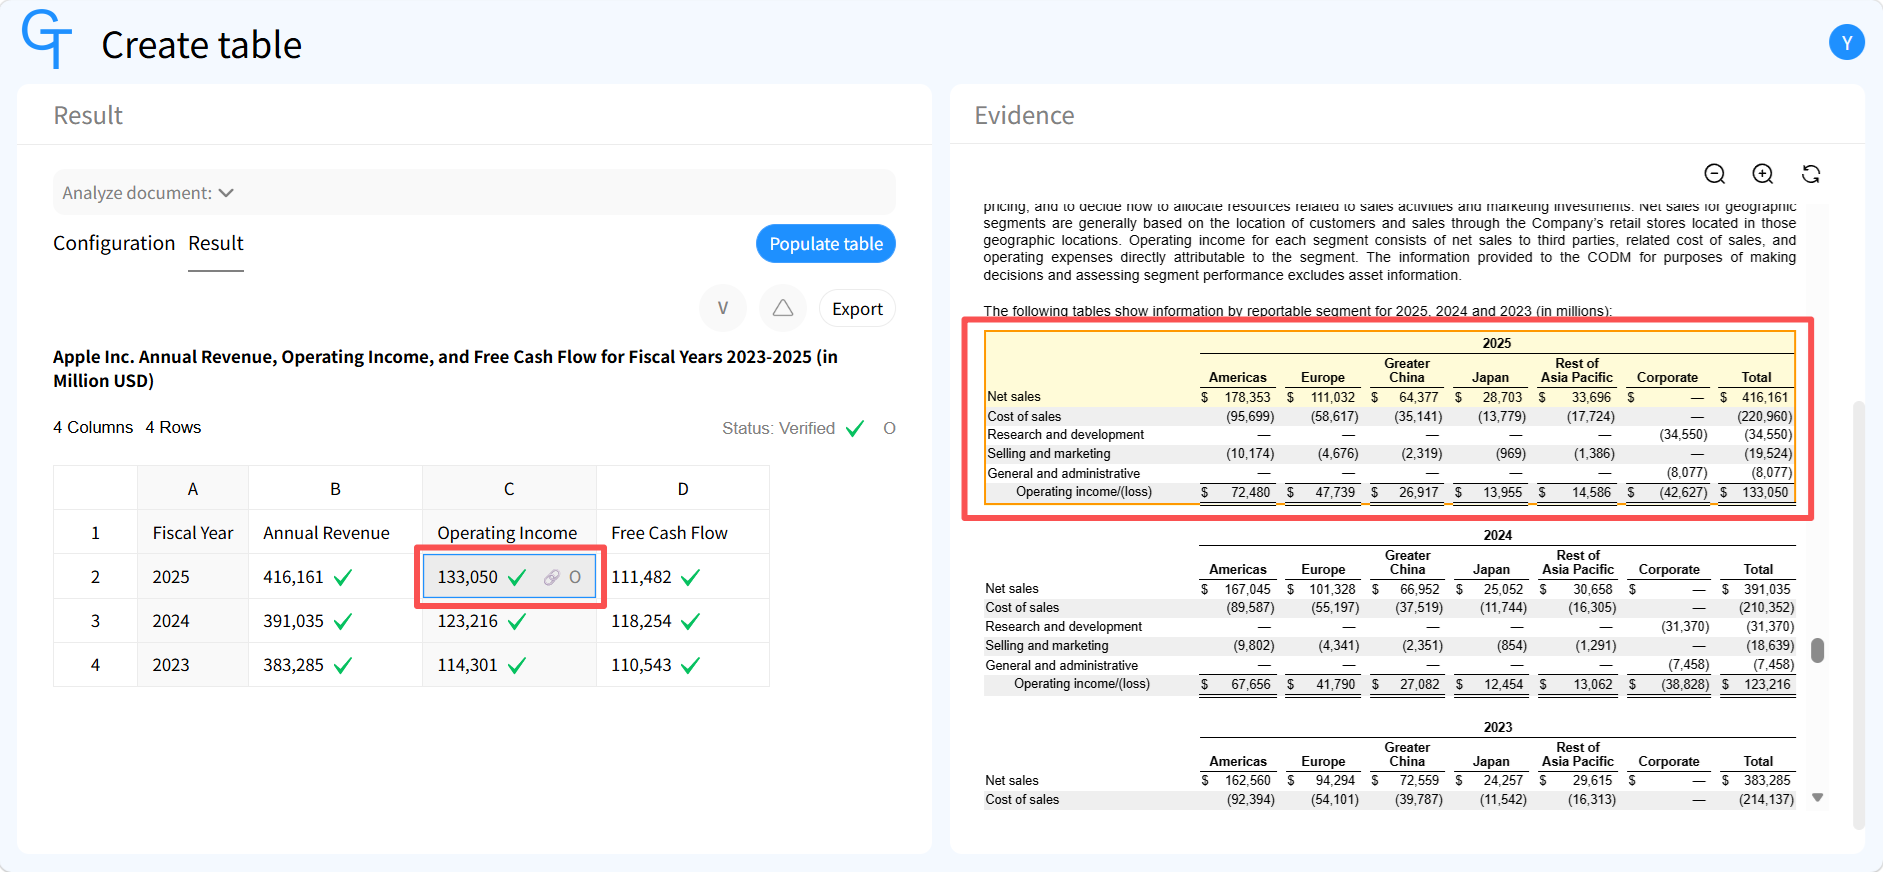 Figure 2. Cell-level verification: tracing a structured value back to source evidence, source chunk, and the original document. Source: Gentables Finance Workspace.
Cell-level verification is particularly important in finance because a single table may contain dozens of numbers from different sources. A revenue figure may come from the income statement, while a free cash flow figure may come from the cash flow statement. Without cell-level traceability, it is difficult to verify each number independently.
4.3 Trace Values to Source Chunks and Original Documents
Structured Value
      ↓
Source Evidence
      ↓
Source Chunk
      ↓
Original Document
The ability to trace a structured value back to its source chunk and original document is what separates a professional-grade financial data workflow from a simple extraction tool. It allows the analyst to:
- Confirm that the value was extracted correctly
- Understand the context in which the value appeared
- Check the period, scope, unit, and currency
- Verify the accounting basis
- Compare the extracted value to the original source
This is not just about catching errors. It is about building confidence in the data. When an analyst knows that every value can be traced to its source, they can use that data with greater confidence.
4.4 Review Context: Period, Scope, Unit, Currency, Accounting Basis
For example, Operating Income: $133,050M may need confirmation of reporting period, currency, unit, consolidated or segment level, and source table or narrative context. Verification is not only checking whether a number exists; it is also checking its semantic and contextual meaning.
Consider a company that reports both GAAP and non-GAAP operating income. A structured table that shows “Operating Income: $133,050M” without specifying which basis is incomplete. The analyst needs to know whether the figure is GAAP or adjusted, reported or pro forma, consolidated or segment-level.
Gentables helps capture this context by linking each value to its source evidence. The analyst can review the original passage and confirm the period, scope, unit, currency, and accounting basis.
4.5 Correct, Export, Share, and Reuse Verified Results
Generated Data
      ↓
Verify Data
      ↓
Review Source Evidence
      ↓
Correct Issues
      ↓
Reuse or Export Results
Results can be exported in Excel, JSON, and Markdown formats and shared with team members. This means that the structured data you build in Gentables can be used in downstream workflows — whether that is a financial model in Excel, a database in JSON, or a report in Markdown.
The ability to export and share structured data is important because financial analysis is rarely a solo activity. Analysts work in teams. They share models, review each other’s work, and collaborate on reports. A structured data workflow that supports export and sharing fits naturally into these team-based processes.
4.6 Verification Supports Professional Review—Not Blind Trust
Verification helps users inspect extracted values against source evidence. It does not eliminate the need for professional review.
This is an important distinction. Gentables is not designed to replace the analyst’s judgment. It is designed to make the analyst’s work more efficient and more reliable. The verification features help the analyst do their job better — but they do not do the job for them.
In finance, professional judgment is irreplaceable. A number may be extracted correctly but still require interpretation. A trend may be statistically significant but not economically meaningful. A disclosure may be technically accurate but practically misleading. These are judgments that only a trained professional can make.
5. Structured Financial Data Across Professional Workflows
5.1 Equity Research: From Company Filings to Structured Research Data
Equity research analysts review annual reports, SEC filings, earnings reports, and company disclosures. Relevant information is often distributed across financial statements, business segments, MD&A, and footnotes.
A typical research workflow might involve:
- Building a historical financial model from 10-K and 10-Q filings
- Extracting segment data to analyze business mix
- Pulling management guidance from earnings releases
- Comparing key metrics across a coverage universe
Gentables helps analysts convert unstructured company filings into structured tables and objects, locate information by section and topic, extract key metrics, generate comparable data, and trace results back to original documents.
Workflow:
Company Filings
      ↓
Relevant Sections & Topics
      ↓
Structured Financial Data
      ↓
Source Verification
      ↓
Research & Analysis
The value for equity research is straightforward: less time spent on manual data collection, more time spent on analysis and interpretation. An analyst who can extract three years of financials in minutes rather than hours has more time to think about what the numbers mean.
5.2 Investment Banking: Structuring Company and Transaction Information
Investment banking professionals work with company filings, financial statements, transaction documents, and presentations. Data often needs to be collected from multiple documents and organized according to templates or comparison requirements.
In a typical M&A process, an analyst might need to:
- Extract historical financials from target company filings
- Build a comparable company analysis from peer filings
- Populate a standardized template with key metrics
- Review source documents for accuracy
Gentables helps teams extract structured financial information, organize comparable tables, populate existing templates, and preserve source links.
Workflow:
Company & Transaction Documents
            ↓
Extract Relevant Information
            ↓
Populate or Build Structured Tables
            ↓
Review Source Evidence
            ↓
Export & Reuse
The ability to populate existing templates is particularly valuable in investment banking, where standardized formats are common. Instead of manually entering data into a template, the analyst can upload the template and let Gentables fill it from the source documents.
5.3 Corporate Finance & FP&A: Organizing Financial Information for Planning
Corporate finance teams work with financial reports, management materials, budgets, and operating data. Relevant information may be spread across different sections and document formats.
In FP&A, the challenge is often not a single document but a recurring process. Every month, every quarter, the same data needs to be extracted from the same types of documents. A structured workflow can make this process more consistent and more efficient.
Gentables helps extract financial metrics, organize revenue, margins, and cash flow, generate structured business overviews, and populate existing analysis templates.
Workflow:
Financial & Business Documents
            ↓
Select Relevant Content
            ↓
Build Tables or Structured Objects
            ↓
Verify Data
            ↓
Reuse in Planning & Analysis
For corporate finance teams, the value is in consistency and reuse. A structured data workflow that can be repeated across periods reduces the risk of manual errors and ensures that planning inputs are based on reliable data.
5.4 Financial Due Diligence: Reviewing Information Across Multiple Documents
Financial due diligence involves reviewing company disclosures, financial statements, supporting documents, and other materials. Data may be distributed across files and require contextual checking.
Due diligence is one of the most document-intensive workflows in finance. A single deal may involve hundreds or thousands of pages of financial statements, management accounts, contracts, and supporting schedules. Organizing this information efficiently is a significant challenge.
Gentables helps extract relevant financial information, narrow document scope by section and topic, organize data into structured tables, and review key data against original evidence.
Workflow:
Multiple Financial Documents
            ↓
Identify Relevant Information
            ↓
Build Structured Data
            ↓
Review & Verify Sources
            ↓
Compare and Reuse Results
Data extraction and verification can support due diligence, but they do not replace professional due diligence, legal review, or financial judgment. The goal is to make the review process more organized and more efficient, not to automate the professional judgment that due diligence requires.
5.5 From One-Time Extraction to Reusable Financial Data
Structured data is a reusable financial asset. The same structured data can be used for subsequent analysis, company comparisons, internal reporting, template filling, team collaboration, and re-verification.
Financial Document
       ↓
Structured Table / Object
       ↓
Verify and Correct
       ↓
Export / Share
       ↓
Reuse in Other Workflows
This is a key differentiator. A one-time extraction tool produces a one-time result. A structured data workflow produces an asset that can be reused. The table you build for one analysis can be used for another. The object you create for one report can be used in a database. The verified data you export can be shared with your team.
In finance, where time is scarce and accuracy is critical, the ability to reuse structured data is not just a convenience. It is a competitive advantage.
6. How Gentables Finance Workspace Brings It Together
6.1 A Connected Workflow from Documents to Structured Data
Upload Financial Documents
          ↓
Understand Document Structure
          ↓
Select Relevant Sections & Topics
          ↓
Build Structured Tables or Objects
          ↓
Compare or Analyze Data
          ↓
Verify Results
          ↓
Trace Values to Source Evidence
          ↓
Edit, Export, Share, and Reuse
This is the complete workflow, from start to finish. Each step builds on the previous one. Document structure informs scope. Scope informs extraction. Extraction informs verification. Verification informs reuse.
The workflow is designed to be flexible. Not every task requires every step. Sometimes you just need to extract a single table. Sometimes you need to verify every cell. Sometimes you need to export and share. The workflow adapts to the task at hand.
6.2 From Structured Data to Verified Results
| Stage | What It Enables |
|---|---|
| Document Structure | Understand document organization |
| Scope & Topics | Focus on relevant content |
| Structured Data | Generate tables and objects |
| Analysis | Work with collected data |
| Verification | Review extracted values |
| Traceability | Connect results to sources |
| Data Management | Export, share, and reuse |
Each stage adds a layer of value. Document structure makes it easier to find information. Scope and topics make it easier to focus. Structured data makes it easier to work with. Analysis makes it easier to generate insights. Verification makes it easier to trust the data. Traceability makes it easier to explain where the data came from. Data management makes it easier to share and reuse.
6.3 Export, Share, and Reuse
Structured data can be exported in Excel, JSON, or Markdown and shared with team members for further review. The export formats are chosen to fit different downstream workflows:
- Excel for financial modeling and analysis
- JSON for databases and applications
- Markdown for reports and documentation
Sharing is built into the workflow. Structured data can be shared with team members, reviewed collaboratively, and reused across projects. This is important because financial analysis is rarely a solo activity. It is a team sport, and the tools should support teamwork.
6.4 Built for Financial Professionals in New York, Chicago, and Beyond
Gentables Finance Workspace is designed for equity research, investment banking, corporate finance, FP&A, and due diligence professionals. It does not replace professional judgment; it improves the efficiency of data processing, verification, and reuse.
The financial centers of New York and Chicago are home to some of the most demanding data workflows in the world. Analysts in these markets work with complex filings, tight deadlines, and high expectations for accuracy. A structured data workflow that can keep up with these demands is not just useful — it is essential.
7. FAQ
What is financial data extraction?
Financial data extraction is the process of converting unstructured financial documents into structured records, such as tables or objects, that can be organized, verified, and reused. It goes beyond simple text extraction by preserving the context — period, scope, unit, currency, and source — that makes financial data meaningful.
How do I extract data from a 10-K?
Upload the 10-K, review the document outline, select relevant sections, discover topics, filter chunks, and generate structured tables or objects using Extract, Summarize, or Populate. The workflow is designed to mirror how analysts actually read a 10-K — starting with the structure and narrowing down to the specific data points.
Can I extract data from specific sections of a financial document?
Yes. Gentables supports outline viewing, section selection, topic discovery, and chunk filtering to narrow the scope before extraction. This is particularly useful for large documents where only a subset of sections is relevant to a given task.
What is the difference between extracting and summarizing financial documents?
Extract generates structured record tables from document content. Summarize generates structured objects such as summaries, overviews, and profiles. Tables are best for repeated records and comparable metrics. Objects are best for descriptive information that does not fit neatly into rows and columns.
How does cell-level verification work?
Each cell in a structured table can be linked to source evidence, source chunks, and the original document, allowing users to review the context behind each value. This is important in finance, where every number needs to be traceable to its source.
Can I trace a structured value back to its source document?
Yes. Structured values can be traced to source evidence, source chunks, and the original document. This provides the transparency that financial professionals need to trust and verify extracted data.
Can I populate my own Excel template?
Yes. The Populate capability supports uploading an existing table template and filling it from the current document. This is useful for analysts who have standardized templates for financial modeling, comparable analysis, or transaction summaries.
Can I export structured financial data to Excel, JSON, or Markdown?
Yes. Results can be exported in Excel, JSON, and Markdown formats. Each format is suited to different downstream workflows, from financial modeling to database integration to report writing.
Does AI-extracted financial data require review?
Yes. Verification helps users inspect extracted values, but it does not eliminate the need for professional review. Financial professionals remain responsible for interpreting and validating the data they use.
Is Gentables Finance Workspace a replacement for financial analyst judgment?
No. Gentables supports extraction, organization, verification, and reuse. Financial professionals remain responsible for review and interpretation. The workspace is designed to make their work more efficient, not to replace their expertise.
8. Conclusion: Build Financial Data You Can Trace, Verify, and Reuse
Financial documents contain valuable information, but turning that information into usable data requires more than copying numbers into a spreadsheet. A structured workflow helps financial professionals organize document content, generate structured tables and objects, review extracted information, and connect results back to their sources.
Gentables Finance Workspace brings these capabilities together in one workspace, helping users move from unstructured documents to structured, traceable data. The workflow is designed for the realities of financial analysis: scattered information, different formats, context-dependent data, and the need for verification and traceability.
Whether you are an equity research analyst building a financial model, an investment banker preparing a comparable company analysis, a corporate finance professional organizing planning inputs, or a due diligence specialist reviewing multiple documents, the same principles apply: structured data is more useful when it can be traced, verified, and reused.
Turn your financial documents into structured data.
Upload a document and explore how Gentables can help you extract, organize, verify, and reuse financial information. Visit Gentables.