Turn Financial Reports into Source-Verified Comparable Company Analysis Tables
Why AI-powered comparable company analysis transforms valuation workflows
Source-Grounded Valuation Multiples
Every valuation multiple (P/E, EV/EBITDA, EV/Revenue, etc.) is derived from specific financial line items and market data, and each source figure is linked to the original document. Click any cell to see the supporting numbers and their exact locations—critical for audit and investment confidence.
Structured Comps Table Ready for Systems
Output is a clean table (CSV, Excel, JSON) with companies as rows and valuation multiples as columns: market cap, enterprise value, P/E, EV/EBITDA, EV/Revenue, P/B, revenue growth, EBITDA growth, and more. Directly import to Excel, BI tools, or financial models.
Automatic Extraction & Calculation
AI identifies the required financial metrics from each company's report, calculates valuation multiples consistently, and normalizes data across different fiscal periods and currencies. Reduces manual errors and speeds up comps analysis.
How to generate a comparable company analysis table in 4 steps
1. Upload financial documents for each company
Upload 10-K, 10-Q, annual reports, analyst research, or company profiles for the peer group. You can upload multiple files at once or add them one by one.
2. AI extracts financial metrics and calculates multiples
Our AI detects revenue, EBITDA, net income, EPS, book value, total debt, cash, shares outstanding, and other required inputs—then calculates market cap, enterprise value, P/E, EV/EBITDA, EV/Revenue, P/B, and growth rates.
3. Review and verify each multiple
The generated comps table displays each multiple with a 'source' button. Click it to highlight the original line item in that company's document—ensuring full traceability for audits and quality assurance.
4. Export and integrate
Export as CSV, Excel, or JSON. Directly integrate with Excel, Google Sheets, or BI platforms via API, or copy the comps table into your valuation model or pitch book.
Built for accuracy, auditability, and speed in valuation analysis
Extract from diverse financial reports
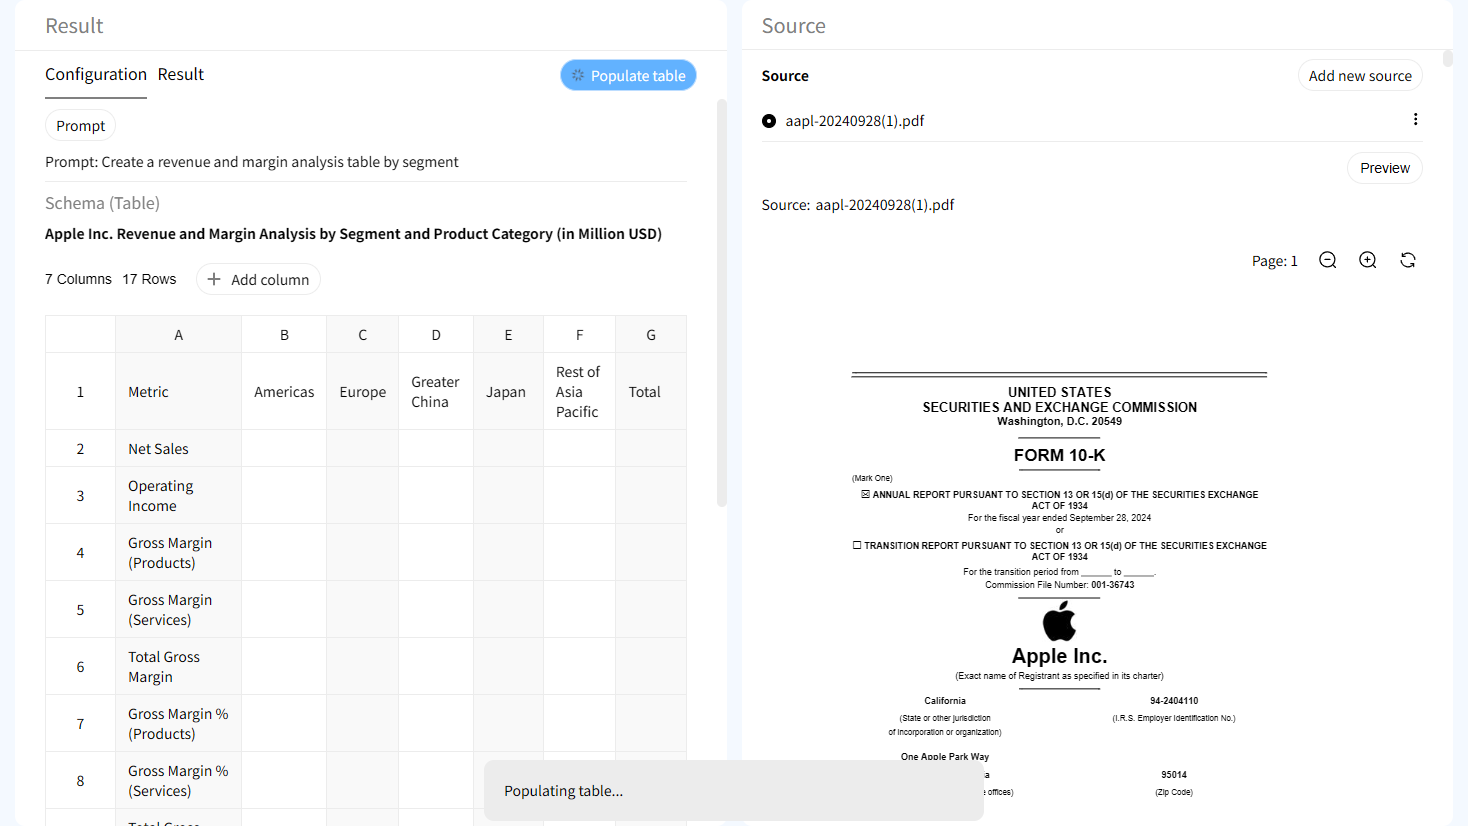
Handles varying formats—10-K, 10-Q, annual reports, analyst research, and multi-page PDFs. AI reliably extracts the required financial metrics even from inconsistent language and layout.
Source verification at the multiple level
Each valuation multiple—from P/E to EV/EBITDA—can be traced back to the original financial line items. Disagree with a multiple? See exactly which numbers were used and where they came from.

Interactive highlighting across documents
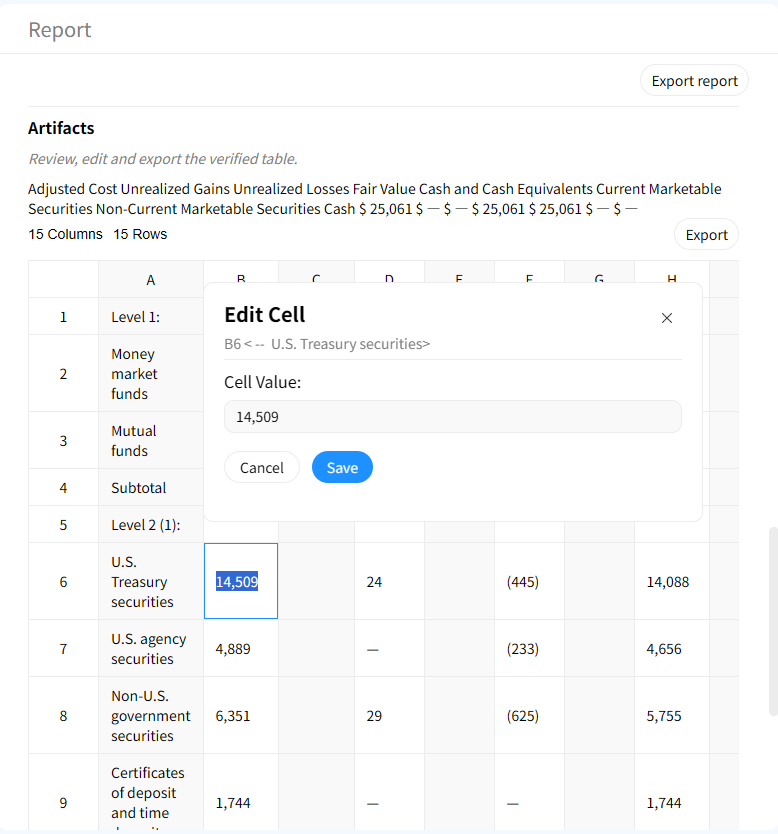
Click any cell in the comps table and instantly jump to the corresponding line item in that company's financial statement—perfect for audits, due diligence, and pitch book preparation.

Human-in-the-loop refinement
AI suggests multiples, but you remain in control. Edit, add, or remove companies and multiples, adjust calculations, or correct misinterpreted data with ease.
AI Comparable Company Analyzer vs Manual Comps Spreadsheet
Manual Comps Building
- • Hours of extracting numbers from multiple reports
- • Prone to data entry and formula errors
- • No traceability to source
- • Inconsistent multiple definitions across peers
Gentables AI Comparable Company Analyzer
- ✓ Comps table generated in minutes
- ✓ Accurate and consistent multiple calculations
- ✓ Source-grounded verification for each company
- ✓ Standardized table ready for valuation models
Who benefits from AI-generated comparable company analysis?
Investment Banking & M&A Teams
• Accelerate pitch book and valuation materials
• Ensure consistent comps across deals
• Reduce manual data gathering time
Equity Research Analysts
• Build and update peer valuation tables quickly
• Compare multiples across coverage
• Validate assumptions with source-linked data
Private Equity & Investment Managers
• Screen potential targets against public comps
• Support LBO and valuation analyses
• Backtest investment theses with reliable data
Frequently Asked Questions about AI Comparable Company Analyzer
Stop manual comps building. Analyze with confidence.