Turn Financial Reports into Structured, Source-Verified Metrics Tables
Why AI-powered financial statement analysis transforms finance workflows
Source-Grounded Extraction
Every extracted metric (revenue, EBITDA, net income, etc.) is linked to the exact line item in your original financial report. Click any cell to see the source context—critical for audit, compliance, and trust.
Structured Data Ready for Systems
Output is a clean table (CSV, Excel, JSON) with all standard financial metrics by period (quarterly or annual). Directly import to Excel, BI tools, or financial management systems.
Automatic Field Mapping & Validation
AI identifies and normalizes financial data even from messy reports—handling varying formats, currencies, and accounting standards. Reduces manual data entry and eliminates transcription errors.
How to generate a structured financial metrics table in 4 steps
1. Upload your financial document
Upload annual reports, 10-K, 10-Q, quarterly earnings, or even scanned PDFs (OCR supported). You can also paste raw financial data directly.
2. AI scans for key financial metrics
Our AI detects revenue, gross profit, operating income, EBITDA, net income, EPS, cash flow, total assets, total debt, and more—using natural language understanding tailored to accounting and finance terminology.
3. Review and verify each metric
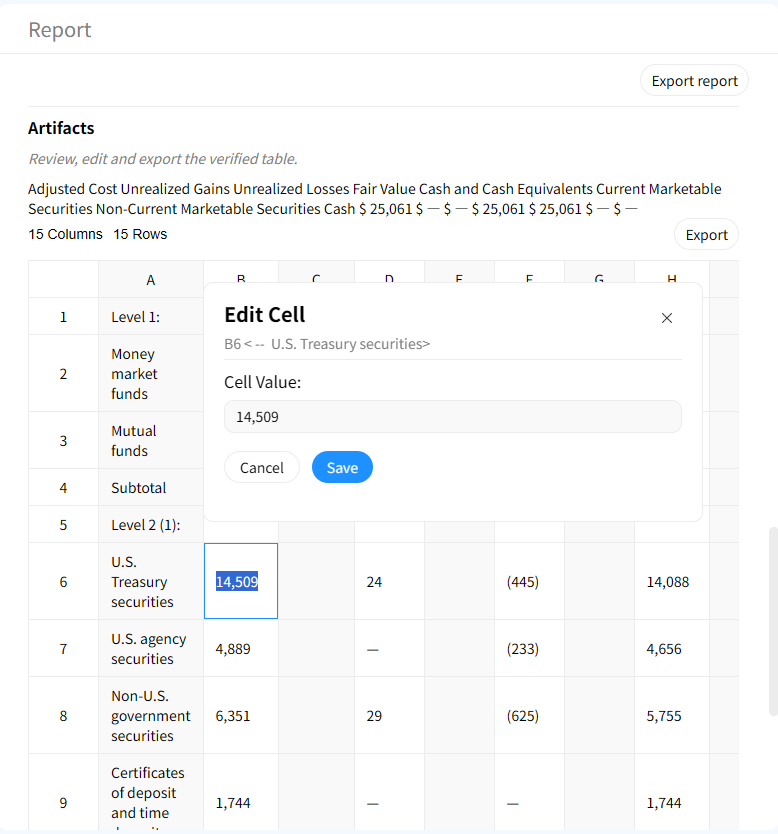
The generated table displays each metric with a 'source' button. Click it to highlight the original line item in your document—ensuring full traceability for audits and quality assurance.
4. Export and integrate
Export as CSV, Excel, or JSON. Directly integrate with Excel, Google Sheets, or BI platforms via API, or copy the structured table into your workflow.
Built for accuracy, auditability, and speed in financial analysis
Extract from messy financial reports
Handles varying formats—annual reports, SEC filings, earnings transcripts, and multi-page PDFs. AI reliably extracts structured metrics even from inconsistent language and layout.
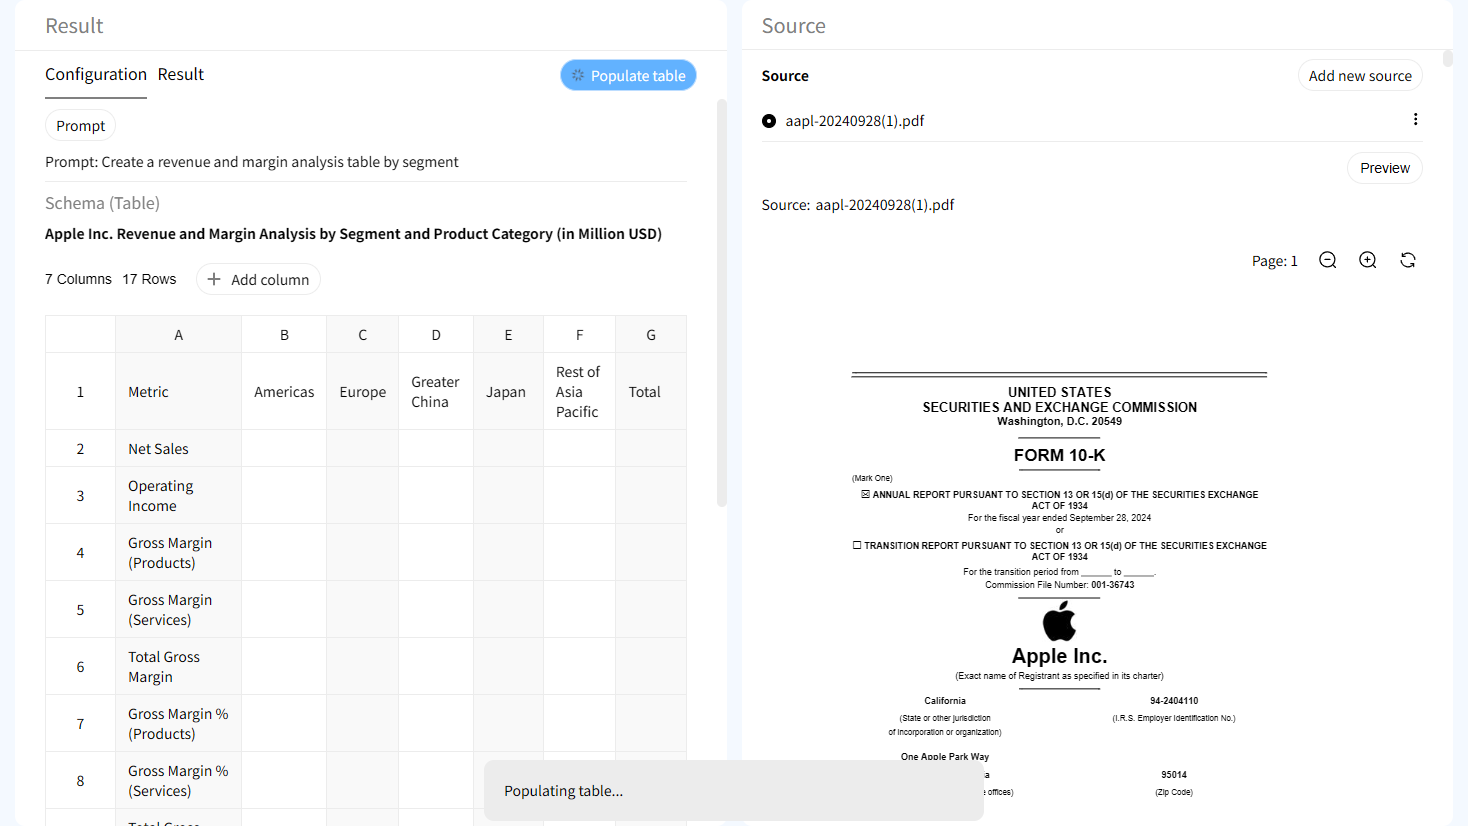
Source verification at the metric level
Each metric—from revenue to total debt—can be traced back to the original text. Disagree with an extraction? See the exact words that triggered it.

Interactive highlighting in source document
Click any cell in the metrics table and instantly jump to the corresponding line item in your financial report—perfect for audits, dispute resolution, and training.

Human-in-the-loop refinement
AI suggests metrics, but you remain in control. Edit, add, or remove fields before finalizing the table. Merge duplicate entries or correct misinterpreted data with ease.
AI Financial Analyzer vs Manual Data Entry
Manual Data Extraction
- • Hours of reading lengthy reports
- • Prone to missed or misread figures
- • No traceability to source
- • Spreadsheet errors and inconsistency
Gentables AI Financial Analyzer
- ✓ Metrics extracted in minutes
- ✓ Captures every key figure accurately
- ✓ Source-grounded verification
- ✓ Standardized table ready for systems
Who benefits from AI-extracted financial metrics?
Financial Analysts & Research Teams
• Accelerate quarterly and annual analysis
• Ensure no critical metric is overlooked
• Improve consistency across coverage
Investment Professionals
• Review financial health with structured data
• Validate key ratios and trends
• Reduce manual data entry errors
Compliance & Audit Teams
• Maintain audit trails of financial decisions
• Verify data accuracy against source documents
• Ensure regulatory adherence with traceable evidence
Frequently Asked Questions about AI Financial Statement Analyzer
Stop manual financial data entry. Analyze with confidence.