Extract Raw Data Points from Any Chart
How to extract data from a chart image
1. Upload your chart image
Any format: PNG, JPG, screenshot, or scanned chart from a paper.
2. AI digitizes the chart
We detect axes, ticks, labels, and data curves or bars – then reconstruct each data point with sub‑pixel precision.
3. Download the raw data
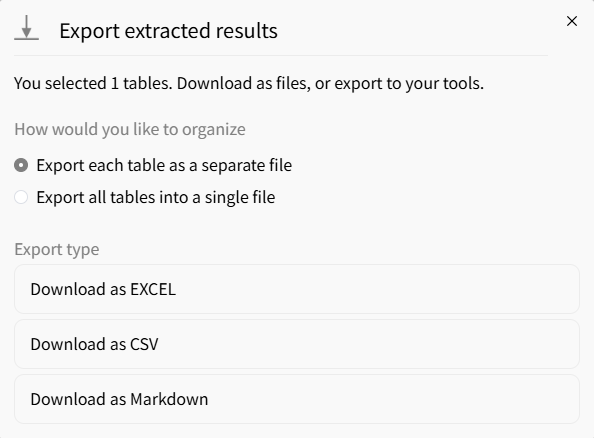
Get a table of x‑y coordinates per series. Choose CSV for pandas/R, JSON for web apps, or Excel for inspection.
Why extract data from charts with AI?
Manual digitizing is slow and inaccurate
- × Guessing pixel positions by eye
- × Dealing with logarithmic or broken axes
- × Hours to digitize a single scatter plot
AI gives you machine‑readable data
- ✓ Automatic axis calibration (linear/log/date)
- ✓ Sub‑pixel interpolation for smooth curves
- ✓ Exports to CSV, JSON, or Excel for immediate use
Advanced chart digitization features
Sub-pixel accuracy & curve fitting
For line charts, we don't just pick discrete pixels – we fit curves to estimate intermediate points, giving you smooth data that matches the original graph closely.
Supports logarithmic, date, and custom axes
Detect axes with log scale (base 10, ln), date/time axes, or non‑linear custom scales. The extracted data points are transformed back to the original units.
Flexible export formats
Export extracted chart data into Excel, CSV, or JSON formats for analytics and reporting workflows.
Who uses chart data extraction?
Academic researchers
• Extract data from published graphs that lack source tables
• Re‑analyze historical scientific plots
• Meta‑analysis across multiple studies
Data scientists & ML engineers
• Turn scanned charts into training data for models
• Extract time series from old reports for forecasting
• Build datasets from competitor visualizations
Journalists & fact‑checkers
• Verify claims by extracting numbers from charts
• Recreate graphs with updated data
• Convert infographic charts to structured tables
Chart data extraction – frequently asked
Get raw data from any chart – start extracting