Create Side-by-Side Comparison Tables with AI
Make confident decisions with AI comparison tables
Multi-Source Aggregation
Upload multiple documents (PDFs, reports, spec sheets) or paste product URLs. AI automatically extracts and normalizes data from all sources into a unified structure.
Smart Dimension Extraction
Instead of manually building rows, AI identifies the critical comparison dimensions—pricing, features, performance, compliance—based on your uploaded context.
Objective Side-by-Side View
Visualize differences instantly in a clean matrix. Every comparison point is traced back to source evidence, ensuring your decisions are data-driven and verifiable.
How to generate a comparison matrix with AI
1. Upload comparison sources
Upload product datasheets, vendor proposals, or financial reports. You can also paste text descriptions of the items you want to compare.
2. Define what matters (or let AI decide)
Specify your comparison criteria (e.g., 'Compare cost, speed, and scalability') or let AI automatically detect the most relevant dimensions from the documents.
3. AI builds the comparison matrix
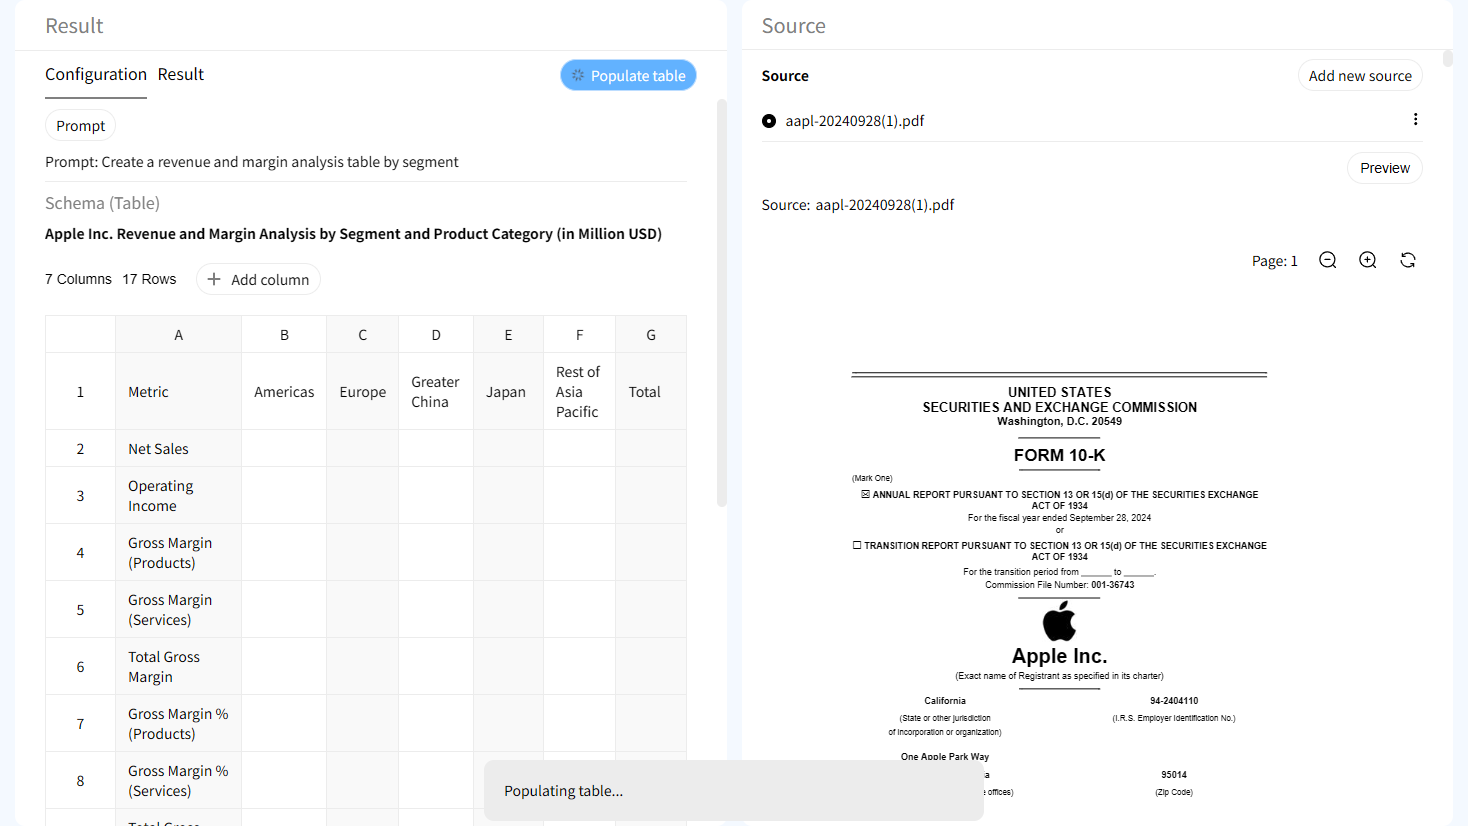
AI organizes extracted attributes into rows and entities into columns, populating each cell with specific data points from the source context.
4. Verify evidence at the cell level
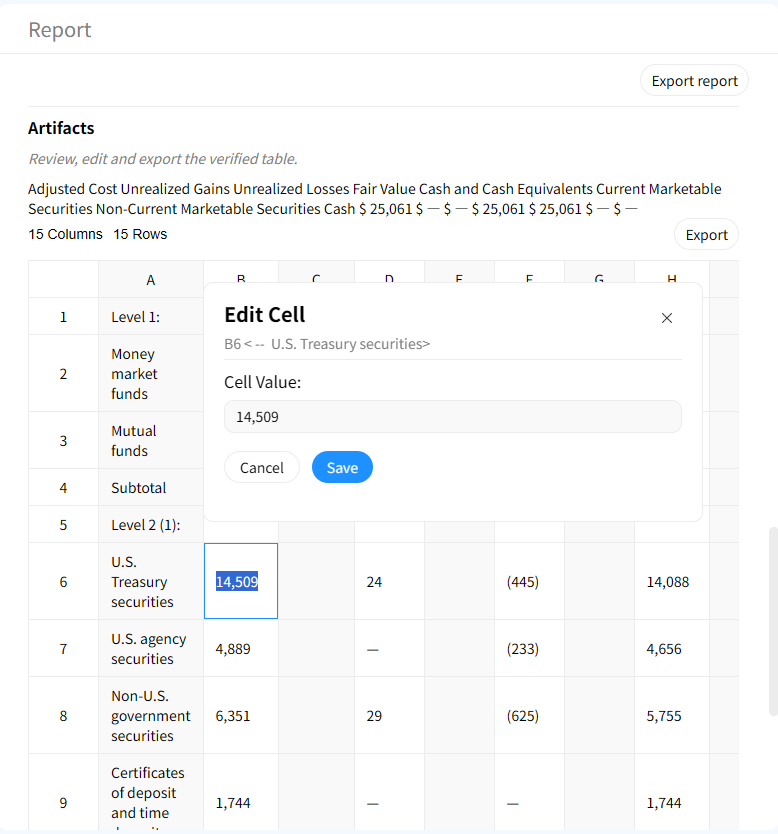
Click any value in the comparison table to highlight the exact source sentence in the original document, validating the AI's extraction.
5. Customize and score
Add custom columns for scoring, adjust weights for priorities, or modify the comparison dimensions interactively.
6. Export as decision-ready reports
Export your final comparison table to Excel or CSV for sharing with stakeholders or integrating into procurement workflows.
Built for high-stakes comparison workflows
Multi-document comparison table creation
Handle multiple sources simultaneously. AI aligns disparate data points from different formats into one cohesive comparison table.
Traceable evidence for every difference
Disagree with a comparison? Click the cell to see the original text. This provides audit-grade transparency for competitive analysis.

Interactive source highlighting
Jump directly from a table cell to the exact location in the source document where the value was found.

Human-in-the-loop workflows
Create traceable tables with evidence trails suitable for investment research, reporting, compliance, and review processes.
AI Comparison Table vs Traditional Spreadsheet Comparison
Traditional Manual Comparison
- • Hours of manual copy-pasting
- • Prone to alignment errors
- • Hard to trace data origin later
- • Static, no auto-updates
Gentables AI Comparison
- ✓ Generates matrix in minutes
- ✓ Cell-level source tracing
- ✓ Auto-extracts hidden dimensions
- ✓ Interactive, evidence-backed
Who uses AI comparison tables?
Product & Procurement Teams
• Compare vendor RFPs side-by-side
• Evaluate SaaS feature sets
• Build cost-benefit matrices
Competitive Intelligence
• Track competitor product changes
• Compare market positioning
• Create feature parity reports
Financial & Investment Analysis
• Compare company financial ratios
• Analyze fund performance metrics
• Evaluate acquisition targets
AI Comparison Table FAQs
Create your first AI comparison matrix