Create Side-by-Side Financial Comparisons with AI
Compare companies' financial health without manual spreadsheets
Multi-Company Financial Aggregation
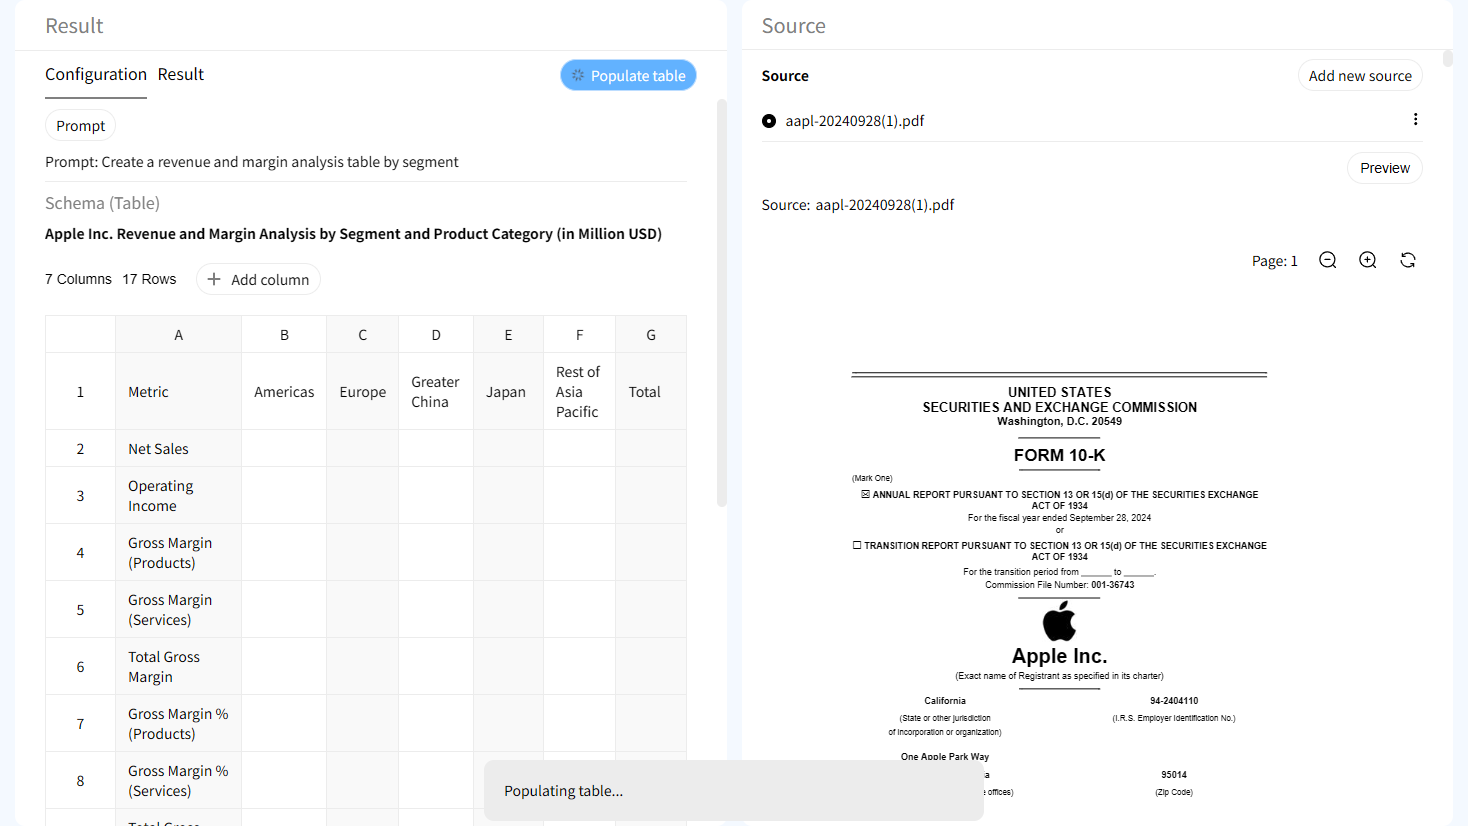
Upload financial reports from competing companies or peers. AI automatically extracts and aligns financial data—revenue, profit, debt, cash flow—into a single unified comparison structure.
Smart Financial Dimension Discovery
AI identifies the most relevant financial metrics for your analysis, whether it's YoY growth, EBITDA margins, current ratios, or R&D spend. No need to define rows manually.
Cell-Level Source Tracing
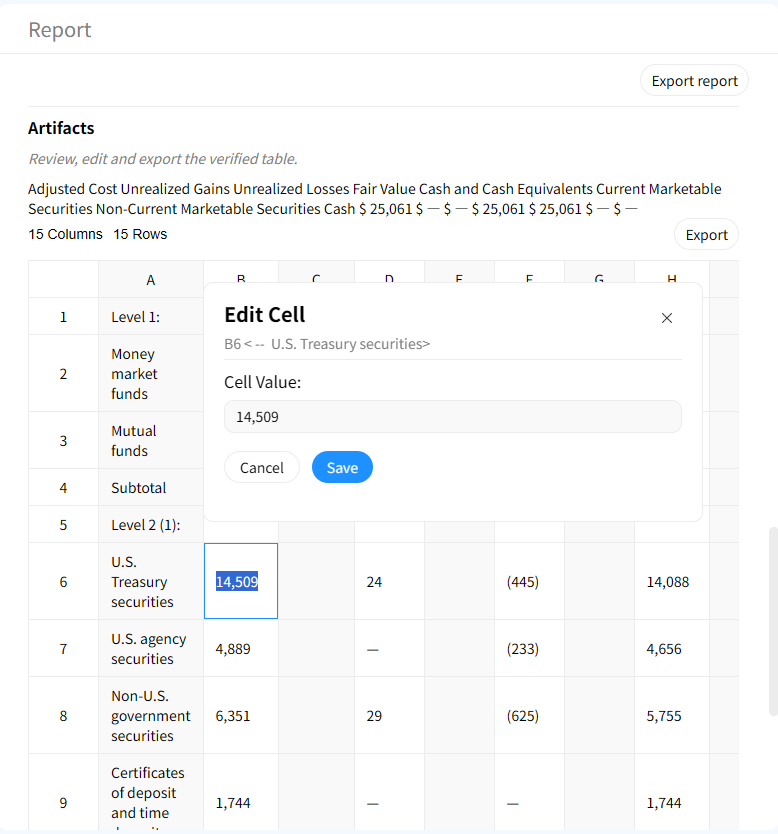
Every financial figure is linked to its original source in the uploaded documents. Click any cell to instantly highlight the exact page and line in the SEC filing or annual report, ensuring your analysis is audit-proof.
How to generate a financial comparison matrix with AI
1. Upload financial reports
Upload 10-Ks, annual reports, quarterly earnings, or press releases from the companies you want to compare. Gentables supports PDF, HTML, and Word formats.
2. Let AI identify comparison axes
AI scans all documents to find common financial data points—revenue, net income, EPS, cash from operations, total debt, and dozens of other line items.
3. Generate the financial comparison matrix
AI populates a structured table with companies as columns and financial metrics as rows, filling each cell with the extracted data from each document.
4. Verify with source evidence
Hover or click on any number to pull up the source evidence panel. Verify the AI's extraction against the original financial statement instantly.
5. Customize metrics on the fly
Add or remove metrics, change fiscal year alignment, or rename rows interactively without re-uploading your documents.
6. Export for investment memos or reports
Download the clean comparison table to Excel or CSV for integration into your financial models, pitch decks, or research reports.
Built for rigorous financial analysis
Multi-document comparison table creation
Handle multiple sources simultaneously. AI aligns disparate data points from different formats into one cohesive comparison table.
Traceable evidence for every difference
Disagree with a comparison? Click the cell to see the original text. This provides audit-grade transparency for competitive analysis.

Interactive source highlighting
Jump directly from a table cell to the exact location in the source document where the value was found.

Human-in-the-loop workflows
Create traceable tables with evidence trails suitable for investment research, reporting, compliance, and review processes.
AI Financial Comparison vs Manual Excel Models
Manual Excel Comparison
- • Days of copy-pasting from PDFs
- • Currency and unit alignment errors
- • Lost source references
- • Static snapshots, hard to refresh
Gentables AI Financial Comparison
- ✓ Generates matrix in minutes
- ✓ Auto-aligns financial line items
- ✓ Cell-level document traceability
- ✓ Interactive, editable, refreshable
Who uses AI financial comparison tables?
Investment Research & Equity Analysis
• Compare financials of peer companies
• Build comparable company analysis tables
• Support buy/sell/hold recommendations
M&A & Due Diligence
• Analyze target company financials vs peers
• Review historical financial performance
• Identify financial red flags or synergies
Corporate Finance & FP&A
• Benchmark internal performance vs competitors
• Build industry financial snapshots
• Support executive dashboards and board packs
Financial comparison table FAQs
Start comparing financials like a pro